

Description
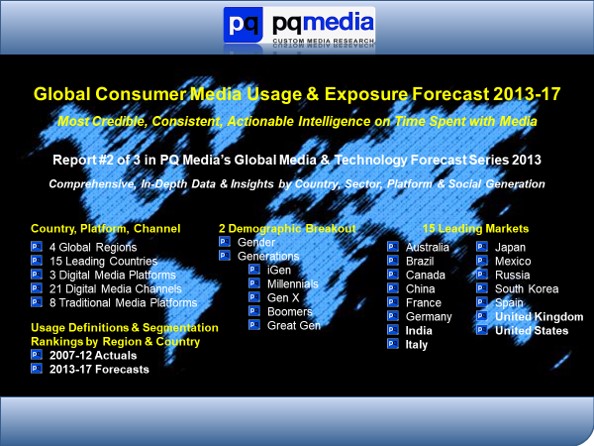
PQ Media Global Consumer Media Usage & Exposure Forecast 2013-17
REPORT #2 in SERIES of 3
PQ Media Announces Launch of Global Consumer Usage of Digital Media Forecast 2013-17 to Deliver First Holistic Cross-Media View of Accelerating Transition to Digital Media Consumption by Country, Platform, Channel, Gender and Generation Worldwide
In this second of three reports in PQ Media’s synergistic Global Digital Media Research Series, PQ Media applied its proven econometric methodology and multi-channel expertise to deliver the groundbreaking research provided in the Global Consumer Usage of Digital Media Forecast 2013-17. The objective of this Report is to provide media executives in the US and 14 other leading countries with actionable strategic intelligence necessary to make smarter, faster and more informed business decisions amid dramatic shifts in consumer media consumption that are disrupting the media, entertainment and technology industries.
Subscribers to the first report in PQ Media’s new Research Series, the Global Digital & Alternative Media Revenue Forecast 2013-17, released in June, could easily spot key digital media tipping points over the past decade. For example, as the global economy was showing some post-recession green shoots in 2010, worldwide digital advertising & marketing revenues grew 15% to $175.7 billion from $153.4 billion the prior year. Also in 2010 total digital media revenues surpassed global TV revenues of $172.1 billion for the first time. And PQ Media sees double-digit revenue growth continuing for digital media through 2017. Why?
Because media dollars always follow eyeballs.
During the global economic upheaval of 2008 and 2009 consumers accelerated their shift from traditional to digital media consumption. This did not go unnoticed by media companies, brand marketers and ad agencies. By year-end 2012, global digital media investments surpassed TV by $33 billion. The ability of online, mobile and other digital media to effectively target and engage on-the-go consumers worldwide has been the major driver of its consistent double-digit revenue gains since 2010.
And eyeballs continue to shift over to digital media.
Not surprisingly, as detailed in the PQ Media Global Consumer Usage of Digital Media Forecast 2013-17, the 2.53 average hours per week consumers spent with digital media in 2007 is on pace to grow to 5.97 hours in 2013. This 136% increase is being driven by growing demand among Millennials, Gen X, and Baby Boomers in Brazil, Russia, India and China, where consumer time spent with mobile and online social media, video, games, books, directories, periodicals and OOT video is growing at double-digit rates. PQ Media forecasts global consumer digital media usage will increase at a 10.7% CAGR worldwide in the 2012-17 period, reaching 8.88 hours per week by 2017.
This second installment of the three-report Series is the only product on the market to track actual digital media consumption and forecast consumer usage shifts from 2013 through 2017 by 3 major digital platforms (online, mobile, other media), 21 media channels, and by gender and generation segments (iGen, Millennials, Gen X, Boomers, Greatest Gen). In-depth market intelligence spans across 4 global regions and 15 leading countries, and included for comparison are eight major traditional media platforms.
Key Features of the Report:
- Exclusive Data, Analytics & Forecasts by Region, Country, Platform, Channel, Gender & Generation
- Media Usage Definitions & Segmentation
- At-a-Glance Rankings of Countries by Avg. Hours Per Week, YoY Growth and CAGRs from 2007 through 2017
- Digital Media Usage Coverage Includes
- 4 Global Regions
- 15 Leading Countries
- 3 Major Digital Media Platforms
- Online
- Mobile
- Other Digital Media
- 21 Digital Media Channels
- 7 Demographic Breakouts
- iGen
- Millennials
- GenX
- Boomers
- Greatest Generation
- 8 Traditional Media Platforms for Comparison
- 2007-12 Actuals
- 2013-17 Forecasts
- 186 Power Point slides with 96 Tables & Charts
- 42 Pages of Analysis
- Companion Excel Workbook with detailed datasets by country, platform, channel, gender and generation, totaling 165,000 data points
- 30 Minute Analyst Call
Video Link: Global Digital Media & Technology Report PQ Media CEO Patrick Quinn shares insights from the new Global Digital & Alternative Media Revenue Forecast 2013-17
Sample Excel Workbook Datasets Available For Download
Global Consumer Media Usage 2007-17 Hours Per Week
-
- Digital MediaUsage – by Demographic, Platform, Channel, Gender & Generation
- Traditional Media Usage – by Gender & Generation
- Digital vs. Traditional Media Usage – by Sector, Gender & Generation
- Share of Consumer Usage of Media – by Digital vs. Traditional Media
- Country Consumer Usage of Media – by Digital Media, Online, Mobile, Other
- Country Subscribers 2007-17 – by Internet, Mobile Phone, Computer Tablets & e-Readers
NOTE
- : Full Excel Workbook includes 99 Tabs and list of 2,500 sources