

Description
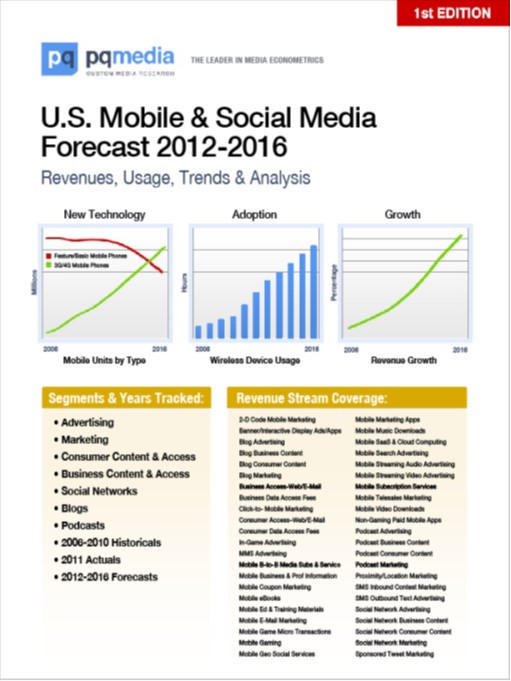
U.S. Mobile & Social Media Forecast 2012-2016
U.S. History, Spending, Trends & Analysis
While much has been written on the explosive growth of mobile & social media, the PQ Media U.S Mobile & Social Media Forecast 2012-2016 provides media stakeholders – media companies, agencies, management consultants, and investment banks – with exclusive growth statistics found nowhere else.
Report Delivers First U.S. Revenue Growth Forecasts for Entire Mobile & Social Media Industry
Most media stakeholders did not anticipate the mobile & social media revolution sparked by billions of worldwide mobile subscribers in 2011.
Executives charged with developing strategic mobile & social initiatives in 2012 are faced with a glut of conflicting forecasts and statistics, making it more difficult to reliably spot the best opportunities for growth and investment. The PQ Media U.S Mobile & Social Media Forecast 2012-2016 provides the first comprehensive guide to help executives navigate this rapidly emerging mobile & social media economy, and a valuable new tool for identifying growth opportunities.
The report is the latest in the authoritative PQ Media Alternative Media Series, and represents the most far-reaching examination of two of the fastest-growing and fastest-changing media in history – mobile & social. The report, for the first time, defines, sizes and structures this highly interconnected and increasingly complex media ecosystem.
What the Report Covers
This highly anticipated report provides historicals, forecasts, trends and analysis for the 2006-2016 period. It is the only econometric statistical report to detail revenues across three broad sectors (mobile advertising & marketing, mobile content & access, and online social media). Subscribers can drill down to seven major segments (mobile advertising, mobile marketing,, consumer mobile content & access, business mobile content & access, social networks, blogs, and podcasts), and drill further down into forty-four distinct revenue streams.
Key Features Included In the Report
- 105 Pages, including 103 tables & charts, a comprehensive list of definitions and detailed Appendix
- Executive Summary
- Key Takeaways
- Trends & Drivers
- Mobile Device Trends – penetration, adoption, usage
- Historical Revenue Data Tracked (3 sectors, 7 segments, 44 revenue streams)
- Revenue Forecasts (3 sectors, 7 segments, 44 revenue streams)
- Chapter – U.S. Mobile Advertising & Marketing
- Chapter – U.S. Mobile Content & Access
- Chapter – U.S. Online Social Media
Mobile & Social Media Business Intelligence Found Nowhere Else
- Total U.S. Mobile & Social Media Revenues 2006-2016
- Share of U.S. Mobile & Social Media Revenues 2006-2016 (ad & marketing, content & access, online social media)
- At-A-Glance Look at Forty-Four U.S. Mobile & Social Media Revenue Stream and CAGRs 2006-2016
- Share of U.S. Mobile & Social Media by Revenue Stream ’06 vs. ’11 vs. ’16
- Brand Category Rank by Mobile Ad & Marketing Segment 2011
- Share of U.S. Mobile Advertising Revenues 2006 vs. 2011 vs. 2016 (steaming video, search, in-game, banners/displays, sms outbound, mms, streaming audio)
- Share of U.S. Marketing Revenues 2006 vs. 2011 vs. 2016 (sms inbound, apps, coupons, 2-D codes, telesales, proximity/location, email, click-to, sponsored tweets)
- Share of U.S. Consumer Mobile Content & Access 2006 vs. 2011 vs. 2016 (web/email, data, gaming, sub-services, video, music/ringtones, micro transactions)
- Share of U.S. Business Content & Access 2006 vs. 2011 vs. 2016 (web/email, data, biz & prof info, ed & training, SaaS & cloud, b2b media)
- Share of U.S. Online Social Media by Segment 2006 vs. 2011 vs. 2016 (advertising, marketing, consumer, business)
Key Questions Answered in This Report
- What are the historical and forecast growth rates across all sectors and segments?
- What is U.S. consumer mobile usage by type – pure play vs. traditional media?
- What is the impact of these new mobile & social media habits for consumers and businesses?
- What are the key mobile & social revenue drivers?
- How are U.S. media consumption patterns changing?
- What is the share of U.S. time spent online with social media?
- How much time is spent accessing content on wireless devices?
- What is the U.S mobile & social media forecast 2012-2016?
- What is the share of U.S. mobile & social media revenues 2006 vs. 2011 vs. 2016
How Media Stakeholders Can Use This Report
Media Companies
- Achieve similar levels of knowledge and expertise among operating managers, strategic planners, finance and market research
- Identify revenue growth patterns and spot opportunities for investment
- Benchmark sales performance against each sector and segment
- Based on forecast growth, drive expenditure decision-making for investment in personnel, programming and technology
- Easily find supporting statistics for senior management recommendations
Advertising Agencies
- Achieve similar levels of knowledge and expertise among media planners, account teams and research
- Evaluate comprehensive sector and segment growth patterns and trends
- Discover insights for immediate and long-term mobile strategy development
- Support creative and media mix recommendations
- Based on forecast growth, drive expenditure decision-making for investment in personnel and technology
Management Consultants
- Business intelligence for clients, associates, managers and team leaders
- Comprehensive data source for long view business model scenario building
- Determine tipping points across sectors and segments
- Evaluate changes in adoption rates
- Anticipate rates of behavioral change
Investment Banks
- Business intelligence for investment bank principals, managing directors and clients
- Insights into fundamental media economy changes
- Evaluate economic realities and growth potential
- Perform cross-platform financial performance analysis vs industry comps
- Identify high and low potential sectors and segments for investment and M&A
- Provide supporting data for due diligence analysis and offering materials
How the Report Was Prepared
PQ Media analysts examined hundreds of documents from mobile and social media stakeholders including research firms, Wall Street analysts, government reports, brands and agencies, newspapers, trade magazines, newsletters and associations, marketing and technology journals, mobile and social media books, and online sites dedicated to mobile and social media trends. More than one thousand public and private companies operating in the mobile and social media market were identified.
Our research methodology is driven by our SpendTrak™ and UsageTrak™ databases, as well as our exclusive Global Opinion Leader Panel™, which together layer the impact of key industry data and variables, including economic, demographic, behavioral, technological and regulatory, with ground-level insights from key industry thought leaders. Our analysts conduct all interviews with senior executives on our worldwide panel. This ongoing marketplace listening process provides PQ Media with priceless business intelligence and rich forward looking insights for all those who support our research reports.