

Digital Out-of-Home Media – Part 1: Definitions & Segmentation
This second edition of this newsletter focuses on one of the most dynamic and fast-growing segments of the media industry over the past decade – Digital Out-of-Home (DOOH) Media – for which PQ Media was the first market researcher to define, segment, size, analyze and project outcomes back in 2007. We have since published 12 editions of the renowned Global Digital Out-of-Home Media Forecast Series (including the 12th edition released in September), which remains the most credible source of comprehensive and actionable econometric data and analysis of advertising revenues and consumer time spent with all digital and traditional out-of-home (OOH) media platforms and channels.
This issue will provide in-depth examination of both major platforms within DOOH Media – digital place-based networks and digital billboards & signage – as well as 11 key indoor venue and outdoor location channels at which these platforms are installed, which are further detailed below. Also provided for broader industry context is a more concise overview of the overall OOH advertising industry, including traditional OOH media.
Out-of-Home (OOH) Media are a collection of static and digital ad media platforms and channels geared to reach and engage target consumers in a variety of transient outdoor locations (ex., roadsides, transit hubs) and more captive indoor venues (ex., cinemas, doctor’s offices). There are four broad categories of OOH media platforms: traditional OOH billboards & posters; digital place-based networks; digital billboards & signage; and ambient OOH media.
Traditional Out-of-Home Media (TOOH) include static billboards & posters located along major highways and roadways and on the sides of large buildings in major cities; transit posters that are located at transit hubs, such as airports and rail stations, as well as in or on moving vehicles, like subway cars, buses and taxis; and street furniture & posters deployed at high foot-traffic locations, such as bus shelters & benches, near public buildings and tourist attractions.
- Static Billboards – walls/spectaculars, posters, bulletins
- Street Furniture – bus shelters, shopping malls, sporting stadiums, parking lots
- Transit – airports, bus depots, gas stations, taxis, subways
Digital Out-of-Home Advertising is defined as ad messages delivered through conduits developed through new digital and video technology aimed at engaging more mobile and captive consumers in less ad cluttered locations outside the home. DOOH media, as defined below, tend to use innovative tech and tactics designed for greater consumer engagement, participation and brand activation.
Digital Place-based Networks (DPN), which are also known as place-based video networks, integrate contextually relevant entertainment, informational and/or educational programming with ad messages narrowcast through digital video screens to engage consumers in relatively captive indoor venues. Consumers often spend extended periods of time in these venues, which include cinema, healthcare, transit, retail, sports & entertainment, and corporate & education venues. The following are some specific examples of these types of venues by channel category:
- Cinema – on-screen, in-theater, lobbies
- Healthcare – doctor’s offices, hospitals, pharmacies
- Retail – big box retail, shopping malls, grocery stores
- Transit – airports, train stations, bus depots, gas stations, taxis
- Sports & Entertainment – stadiums & arenas, restaurants & bars, gyms & spas, hotels
- Corporate & Education – office buildings, government centers, elevators, college campuses
Digital Billboards & Signage (DBB) communicate primarily advertising-only messages through screens equipped with LED or LCD technology and the ads are often changed at predetermined times to showcase multiple brands, as well as to target specific audiences during particular dayparts at various outdoor locations, including roadside, transit, retail and entertainment. The following are some specific examples of these types of venues by channel category:
- Roadside – highways, major roads & exit ramps; on buildings & holographs
- Retail – big box, grocery stores, parking lots, convenience stores, shopping malls
- Transit – airports, train stations & subways, gas stations, taxi tops, buses, blimps
- Corporate & Education – college campuses, corporate buildings, military campuses
- Sports & Entertainment – restaurants & bars, tourist attractions, live events, leisure sports, arenas
Digital Out-Of-Home Media – Part 2: Global OOH Media Ad Market Analysis
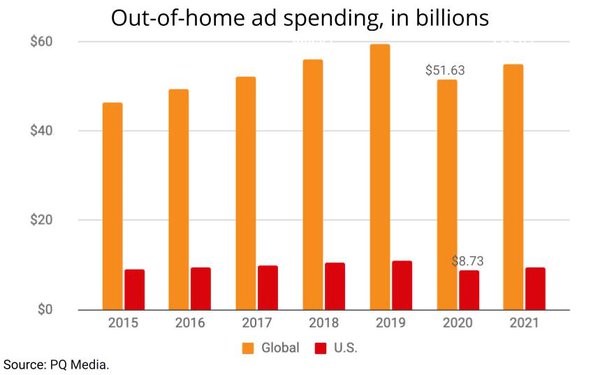
Global OOH advertising revenues, including all digital, traditional and ambient media platforms, declined 13.3% to $51.63 billion in 2020, the steepest drop the OOH ad industry has ever endured, driven down by the deep impact of COVID-19 and the pandemic’s aftereffects worldwide. Although 2020 was the most difficult year on record for the entire OOH media industry, 2021 has shaped up into a strong recovery, with global OOH revenues expected to increase 6.6% to $55.03 billion, followed by accelerating growth in 2022, fueled by double-digit expansion in the DOOH media segment, according to the Global Digital Out-of-Home Media Forecast 2021-2025.
While recessions have negatively impacted OOH media throughout the medium’s history, the pandemic was especially brutal due to the devastating combination of the ad pullback amid weakening economic conditions and the stay-at-home mandates that sapped auto, transit and retail traffic from key OOH media locations worldwide. Billboard CPMs, both digital and traditional, plummeted from desolate highways and vacant city streets, while the transit category was also severely affected, with fewer people flying and riding trains, which led to ads on public transportation being rarely seen. In the retail sector, malls were hit particularly hard, as decreased foot traffic made ads on escalators and elevators virtually obsolete.
A bright spot amidst the thick clouds in 2020 was in the ambient OOH media segment, where boxes and wraps saw an influx of orders due to the skyrocketing number of home deliveries. Aside from grocery stores, pharmacies and big-box retailers, the majority of digital place-based networks (DPNs) and digital signage operating in the retail and entertainment sectors saw plummeting ad revenues because of store closures and stay-at-home restrictions during the lockdown. The entertainment industry, particularly theatrical films and live events, were decimated as major annual concerts, festivals and potential blockbuster films were canceled or postponed, while theme parks closed and many sporting events were canceled or played with no fans in attendance.
But while the economic damage wrought by the pandemic squelched a decade-long expansion that was building momentum in early 2020, PQ Media’s research indicates that OOH media, and particularly DOOH media, is poised for strong growth in the second half of 2021, as the healthcare, transit, and corporate & education venue categories are expected to surge ahead with accelerating double-digit growth in 2022. Among the key growth drivers are the continued expansion of programmatic media buying to OOH media operators outside the top-tier players, increased use of mobile integration tactics and improving ROI metrics driven by smart technology.
In addition, miles driven by global consumers had already exceeded 2019 levels by mid-2021, while static and digital billboards and signage in key indoor and outdoor locations were also recording strong growth in demand and CPMs versus the prior two years. Meanwhile, major international sporting and entertainment events were coming back on track for the second half of 2021 and 2022, with DOOH being used to provide ad-supported live performances, results and updates in key markets worldwide.
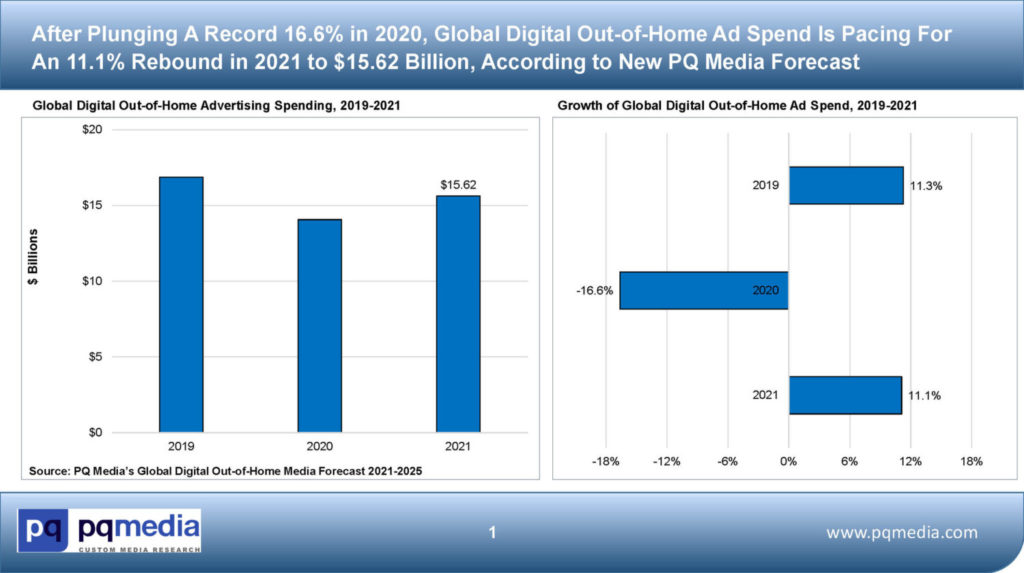
After plunging a record 16.6% in 2020, global DOOH ad spend will rebound 11.1% in 2021 to $15.62 billion, driven by robust growth in digital corporate, healthcare and transit networks. With the healthcare, transit and roadside categories surging to the fore as growth leaders in the years ahead, global DOOH media revenues will rise at a 12.2% CAGR in the 2021-2025 period, accounting for 34.2% of all OOH ad spend.
PQ Media projects that overall OOH ad spend worldwide will rise at a 7.3% CAGR from 2021-2025, as transit re-emerges as the hottest overall OOH media category in 2022 due to major markets upgrading airport terminals, adding new rail lines and deploying new digital signage in high-traffic areas popular with tourists.
The six largest global OOH media companies – JCDecaux, Clear Channel Outdoor, Focus Media, Stroer, Lamar and Outfront Media – were the only OOH operators to exceed $1 billion in revenues in 2020. Nine other global OOH operators generated revenues of more than $110 million, resulting in the Top 15 operators accounting for 23.3% of worldwide OOH ad revenues.
Out-Of-Home Media’s Pandemic Paradox: US Time Spent Rose As Ad Spend Crashed
In the ultimate paradox for an advertising medium, the time spent with out-of-home media among Americans actually expanded during the 2020 COVID-19 pandemic, but spending by American advertisers fell, according to PQ Media’s Global Digital Out-of-Home Media Forecast 2021-2025.
While total time spent among Americans expanded 0.5% to 2.86 hours weekly – continuing an ongoing trend – US OOH ad spend fell 21.1% to $8.73 billion in 2020, as demand crashed amidst the COVID-19 pandemic.
The ad spend attrition was even worse for DOOH media – which fell 23.0% to $2.89 billion – and worst-of-all for cinema advertising within it, which cratered 44.3% last year, per PQ Media estimates.
While all of forms of OOH ad revenues are expected to expand again this year in the US – 3.5% for cinema, 9.2% for overall DOOH media, and 7.3% for total OOH – the marketplace will not return to pre-pandemic levels until 2022 for digital and 2023 for total OOH. PQ Media projects similar patterns of crashing and rebounding for the global OOH ad marketplace, with digital contracting 11.9% in 2020, but expanding 4.9% this year, and total OOH ad spend falling 13.3% in 2020, but rising 6.6% this year.
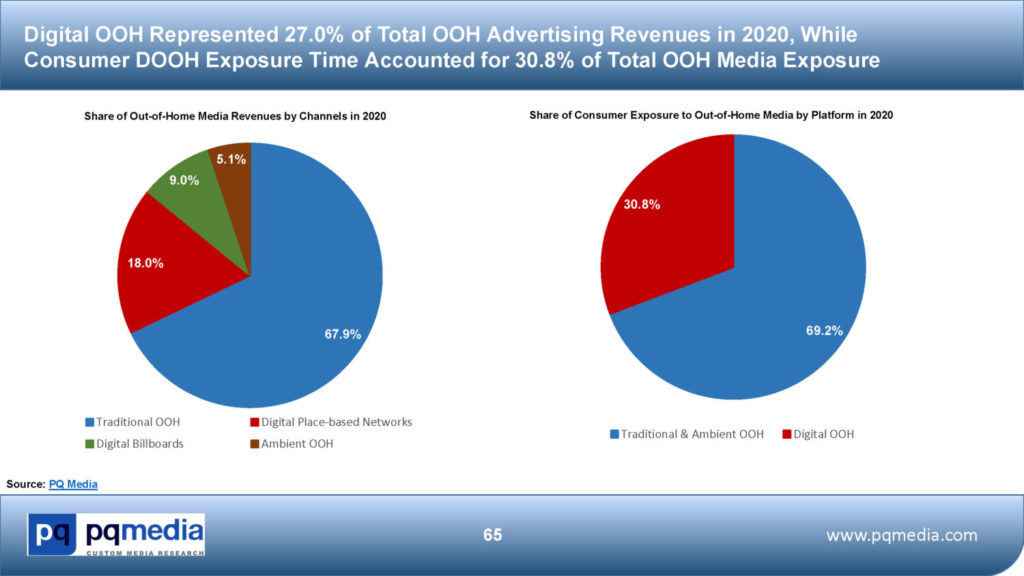
Meanwhile, average weekly consumer time spent with OOH media, which consistently grew for a decade, declined 6.2% worldwide in 2020 to an average of 1 hour and 7 minutes, driven down by cancellations and postponements of major international events, such as the rescheduling of the Tokyo Summer Olympics to the summer of 2021. As a result, consumer time spent with OOH media is projected to rise 1.6% this year, fueled by a 6.3% surge in average weekly consumer exposure to DOOH media.
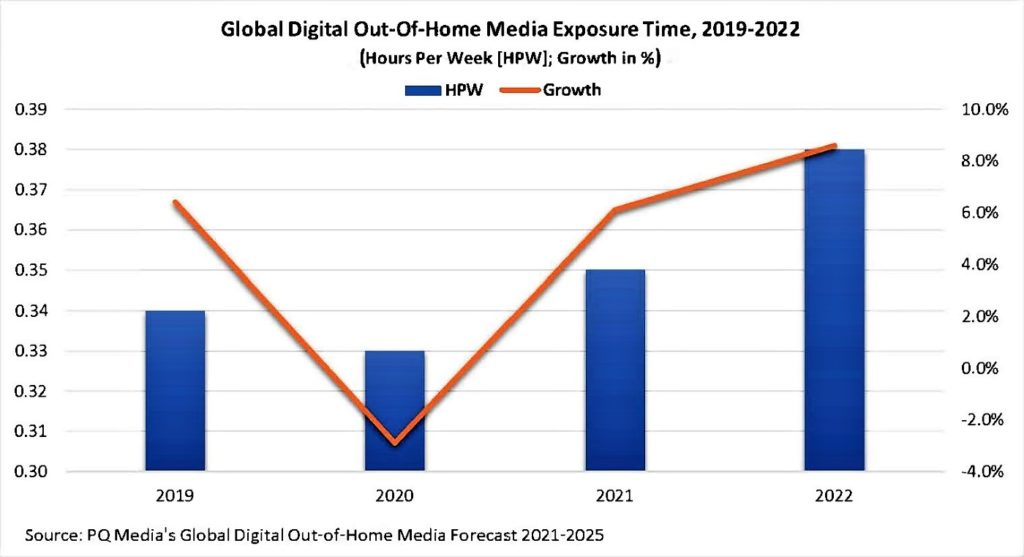
Consumer exposure to digital OOH media worldwide declined 2.9% in 2020 to an average of 20 minutes per week, but will increase 6.1% in 2021 and grow at an accelerated 8.6% in 2022, according to PQ Media.
Global DOOH exposure time will increase at a 7.3% CAGR to nearly 30 minutes per week in 2025, grabbing a 40.4% share of total consumer time spent with OOH media, according to the Global Digital Out-of-Home Media Forecast 2021-2025.
Key drivers of consumer DOOH exposure growth in the years ahead include the rapid expansion of programmatic media buying, increased use of more dynamic mobile integration tactics and the continued advancement of smart technology-driven ROI metrics. Meanwhile, major international sporting and entertainment events were coming back on track for the second half of 2021 and 2022, with DOOH being used to provide ad-supported live performances, results and updates in key markets worldwide.
Transit will re-emerge as the hottest overall OOH media location category in 2022 due to major markets upgrading airport terminals, adding new rail lines and deploying new digital transit signage and networks in high-traffic areas popular with tourists. In addition to transit with the healthcare, transit and roadside fueling consumer time spent with DOOH media going forward.
Digital Out-Of-Home Media – Part 2: US DOOH Market Analysis
In the United States, after plummeting 23.0% in 2020 to $2.89 billion, DOOH ad spend is projected to rebound in 2021, accelerate sharply in 2022 and rise at an 8.9% CAGR to $4.43 billion in 2025 for a 37.1% share of total US OOH ad spend. Corporate & education DPNs will post the strongest growth in 2021, up 19.4%, followed by healthcare (up 14.1%) and transit (up 13.7%). PQ Media’s research indicates that healthcare will surpass cinema to become the largest DPN category in the US by year-end 2023, marking the first time cinema will not lead the overall US market.
The story in the US market has essentially mimicked the global trends. Until 2020, OOH ad spend in the US was the only traditional medium that had never seen total revenue decrease from year to year. This was mainly because the industry had more signage to sell, especially when converting static signs to digital. For example, digital billboards can carry up to 10 ads, whereas most static signage can only run one.
And, of course, the rebound in overall OOH advertising has been fueled by the rapid transition to digital signage and networks across all major indoor venue and outdoor location channels. Specifically, digital platforms, data, targeting initiatives, video screens, digital systems and processes have enabled the DOOH media segment to march out of the pandemic’s apex in 2020, as evidenced by increased programmatic selling of DOOH ad inventory, which has helped fuel revenue growth in 2021.
Programmatic has further demonstrated the flexible and agile nature of DOOH media to pause and push schedules and move campaigns to where the intended audiences exist. Additionally, the deprecation of the cookie and IDFA issues is starting to move ad investments to the reliable value of advertising in a real-world context.
In another first for the US market, China will top America as the world’s largest overall OOH market and the biggest DOOH market in 2021 and will remain the world’s largest OOH and DOOH market throughout the 2021-2025 period. China will generate ad revenues of $10.84 billion in 2021, while the US will generate $9.37 billion. Other markets to exceed $1 billion in revenues this year include Japan, the UK, Germany, France, Brazil, Russia, Australia and South Korea, according to PQ Media.
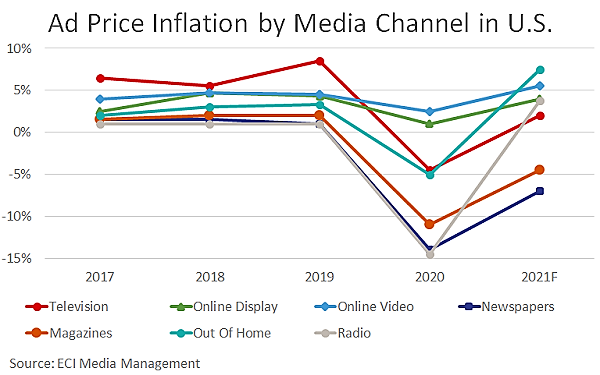
Meanwhile, the economic recovery from the pandemic-led recession last year has helped drive greater demand for advertising in the US, particularly among OOH media and audio/radio media, as the rebound has been uneven among different media channels in 2021, according to ECI Media’s ad price projections.
OOH media ad prices are expected to increase 7% this year – the strongest growth among the seven overall media platforms covered – following a 5% decline in 2020, driven primarily by DOOH advertising at various indoor and outdoor locations. Key growth drivers are more people commuting to work, traveling and shopping at bricks-and-mortar venues. A similar dynamic is at work with audio media, which will see the biggest swing in ad prices this year, after experiencing a 14% drop in 2020. Fueled by higher demand for drive-time dayparts, audio/radio will see gains of about 4% in 2021.
Among the other major media platforms covered, television has stronger pricing power as ad budgets return to pre-pandemic levels, driving demand in the upfront market and higher scatter prices. Online video and display media, which managed to increase prices last year as consumers spent more time with connected devices, are again commanding higher prices, while newspapers and magazines are experiencing a second straight year of deflation, the only media platforms still declining, according to ECI.
Digital Out-of-Home Media – Part 3: Global & US OOH/DOOH Media Deep Dives
Key OOH/DOOH Growth Drivers 2021-2025
- Programmatic media buying becoming the norm and major revenue driver of DOOH media;
- People traveling again by air and auto, as miles traveled exceeded 2019 levels by 2H21;
- DOOH signage and networks increasingly using mobile and smart tech audience measurement solutions, such as eye-dwell monitoring to expand consumer engagement with brands;
- With international sporting events coming back in 2021 and 2022, DOOH media being used more to provide ad-supported live results;
- Digital healthcare, transit, roadside, and corporate & education networks and signage will be fastest growing location & venue categories
Key OOH/DOOH Growth Challenges 2021-2025
- Some OOH and DOOH categories hurt by pandemic struggling to return to 2019 levels, particularly cinema, retail and various local markets worldwide, struck again by delta variant in 2H21;
- OOH/DOOH measurement standards controversy emerged again in mid-2021 due to new standards being released by OOH trade associations and management shakeups within these organizations;
- Chip shortages and other supply chain issues making it more difficult to deploy new digital signage;
- Planning & buying processes complicated by agency turnover and education of new staff re: benefits of OOH ads;
- Privacy issues remain an issue as more metric tools requiring access to mobile phones
Full Market Outlook & Free Report Downloads
PQ Media’s Global Digital Out-of-Home Media Forecast 2021-2025 is the 12th edition of the world’s first and only source of consistent, comprehensive and in-depth strategic intelligence providing exclusive industry data, drill-down market insights and five-year growth projections of digital and traditional OOH media ad revenues and consumer time spent with all OOH media platforms operating in 11 major indoor venue and outdoor location channels across the top 20 global markets and including time spent data on 6 key consumer generations.
The new edition of the Forecast is the only primary research source to deliver actionable econometric data and analytics covering every aspect of the DOOH and overall OOH media industry’s two KPIs – advertising revenues and consumer exposure time – by media platform, venue/location channel, top 20 global markets, and six consumer generations.
Site licenses to the new Forecast include two key deliverables: 1) PDF Report & Analysis in PowerPoint format delivering 450 slides of original data, analysis and datagraphs, including in-depth profiles of the top 20 OOH media markets worldwide; and 2) Deep-Dive Excel Databook providing thousands of drill-down datasets and actionable datapoints delivering the most comprehensive coverage of the global OOH industry available.
For more details on the new 12th edition’s content and pricing, as well as to download a FREE Executive Summary and Sample Datasets from the report, just click on the following link: Global Digital Out-of-Home Media Forecast 2021-2025 .